Analysis Tools Menu
The Analysis GUI "Tools" menu contains a number of tools which can be used to improve or assess model stability or validity as well as investigate general data information content.
Cross Validation
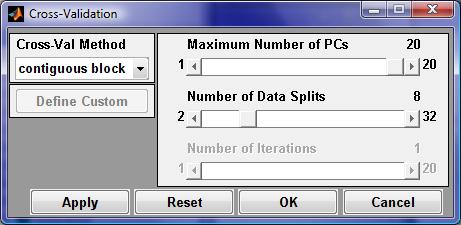
Cross-Validation displays an interface for selecting and configuring a cross-validation method (see Using Cross-Validation for more information). Cross-Validation is not available for all methods.
Cross-Validation GUI.
The Apply button will change crossval settings in Analysis but not close the GUI. Clicking OK will change the crossval setting and close the GUI. Reset will changes the setting in the crossval GUI to the original values and Cancel closes the GUI without making changes.
Correlation Map
The Tools/Correlation Map menu you can select 3 different options for producing a pseudocolor map which shows the correlation of between variables (columns) in a data set.
- No variable reordering (keep original order).
- Standard sign-sensitive variable reordering.
- Absolute value variable reordering (positive or negative correlated variables are grouped together).
Estimate Factor SNR (Signal to Noise Ratio)
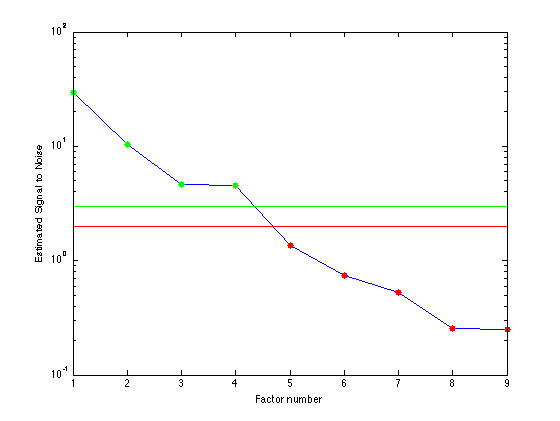
Displays a plot of an estimate of the signal to noise ratio for each principal component. Ratios of 2 or below are dominated by noise, above 3 are OK, and between 2 and 3 are considered threshold and their use is a judgment call. The number of factors needed to describe the data is the number of eigenvectors with signal to noise ratios greater than about 2.
Estimate Factor Signal to Noise Ratio Plot.
See estimatefactors for more information.
Test Model Robustness
The Tools>Test Model Robustness menu displays sections for testing a regression model for robustness to various effects using the testrobustness function.
Given a regression model and validation (test) data x and y, this function performs one of several tests to assess the effect of different perturbations on the test data x-block. The effect on prediction error, Q and T^2 are mapped as a function of the test parameters.
The three types of tests performed:
- interference : adds a gaussian peak of varying width and position tothe x-block data. Results are mapped by peak width and position.
- shift : shifts and broadens the x-block data and maps the results relative to shift amount and width of broadening filter. Filter is based on savgol filter of a specified order and width (see options.)
- singlevar : adds the standard deviation of each variable and divides it by 100. This loop is done one variable at a time. Results are differences in prediction between the original samples and the perturbed samples.

