Sample Classification Predictions: Difference between revisions
imported>Donal |
imported>Donal |
||
| Line 28: | Line 28: | ||
==Example of Classification Information in Scores Plot== | ==Example of Classification Information in Scores Plot== | ||
<gallery caption="Classification Information in Scores Plot" widths="798px" heights="547px" perrow="1"> | |||
File:Scoresplot_classification.png|Scores Plot (right) and its Plot Controls (left) for PLSDA on arch dataset. | |||
</gallery> | |||
Revision as of 14:53, 29 September 2011
Classification Information in Scores Plot
It is possible to view results of predicting classification of X-block samples in the Scores Plot when using analysis methods PLSDA, SVMDA, KNN or SIMCA. These analysis methods determine the probability that a sample belongs to each of the possible classes. Based on this the user can view plots showing the most probable class of each sample according to the model predictions. The "Plot Controls" window for the scores plot shows several classification fields among the choices of X or Y fields to plot. For example, setting the Plot Controls X field = "Sample" and the Y field = "Class Pred Most Probable" will show the most probable class for each sample in the Scores Plot.
In this "Class Pred Most Probable" case the Y axis ranges over class numbers and a sample belonging to class = 2 is shown at (x,y) = (sample number, 2). Points are drawn with distinct symbols for each class and inserting a figure legend shows the class ID associated with each symbol.
There is always a most likely class for a sample to belong to but it is possible that the sample is not well modeled and has low probabilities for all classes. Or it is possible that two classes are similar and a sample belonging to one of them will also have a high predicted probability of belonging to the second class too. In these situations there can be little confidence in the "most probable" class prediction. The choice labeled "Class Pred Strict" addresses these situations by assigning the sample to the "unknown" class (zero) if the most likely class probability is less than 0.5 or if two or more classes have probability of greater than 0.5 for the sample.
The predicted probability that a sample belongs to a particular class, for example the class named <classID>, is available under the label "Class Pred Probability <ClassID>". A sample belonging to this class will have value = 1, or 0 otherwise.
The label "Class Pred Member <ClassID>" identifies samples which have predicted probability > 0.5 of belonging to class "<ClassID>". These samples will have value = 1, or 0 otherwise. Note that label "Class Pred Member - unassigned" identifies samples which were not assigned to any class because no predicted probability was greater than 0.5.
Finally, label "Misclassified" identifies samples where the predicted "Class Pred Strict" does not agree with the sample's actual class. For SIMCA and PLSDA the actual class could include more than one class and the sample is misclassified if its "Class Pred Member <ClassID>" do not correctly predict the actual class(es). If the sample's actual class is unknown then the sample will not be identified as as misclassified.
Example of Classification Information in Scores Plot
- Classification Information in Scores Plot
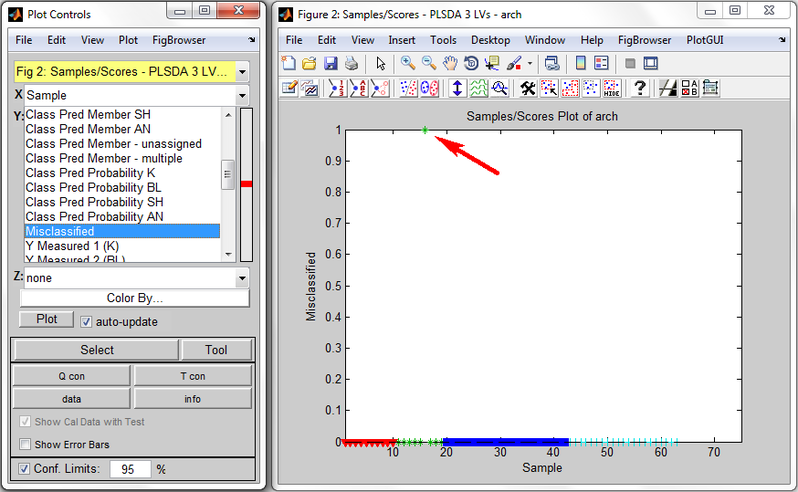
Scores Plot (right) and its Plot Controls (left) for PLSDA on arch dataset.
