Sample Classification Predictions: Difference between revisions
imported>Donal |
imported>Donal No edit summary |
||
| Line 72: | Line 72: | ||
KNN models include the probabilities of each sample belonging to each possible class in the model.classification.probability field. This is an nsample x nclasses array, where the columns are the classes, in the order given by model.classification.classids and model.classification.class. The probability that a sample belongs to class ‘A’ is calculated as the the fraction of nearest-neighbors which have that particular class. | KNN models include the probabilities of each sample belonging to each possible class in the model.classification.probability field. This is an nsample x nclasses array, where the columns are the classes, in the order given by model.classification.classids and model.classification.class. The probability that a sample belongs to class ‘A’ is calculated as the the fraction of nearest-neighbors which have that particular class. | ||
====SIMCA==== | |||
SIMCA calculates the probability of each sample belonging to each possible submodel class or class group. The calculation of a sample’s probability of belonging to a particular submodel class, say class ‘A’, involves examining the Q and T2 statistics for the sample in that sub-model. | |||
This is done for each possible class in turn and the results are saved in PLSDA models as model.classification.probability. | |||
The calculation of class probability for a sample from Q and T2 are based on the model’s estimation of the residuals’ distribution and the specification of a ‘simcathreshold’. A default simcathreshold = 0.95 specifies a confidence level for Q and T2 which should correspond to a probability of 50%. The calculation of probability for SIMCA models is calculated by taking the confidence level of the larger statistic (C) and setting prob = (1-C)/(1-simcathreshold)*0.50. | |||
For example, with simcathreshold at 0.95 (giving 50% probability), a confidence level of 0.98 corresponds to a probabilty of 20% and a confidence level of 0.92 corresponds to 70% probabilty. A value of 0.50 uses "raw" confidence level as probability. | |||
Revision as of 16:46, 21 December 2011
Viewing classification results for samples can be done through the scores for a PLSDA, SVMDA, KNN or SIMCA model. If the model has been applied to test data, predictions will also be available for those samples. The predictions for the calibration data are "self-predictions" (predictions for the model on the calibration data itself.)
Results can be viewed as a plot using the Plot Scores toolbar button in Analysis (or the plotscores command at the command line) and can be viewed as a table by selecting File > Edit Data from the Plot Controls window while viewing a scores plot, or by using the Edit Data toolbar button on the scores plot itself.
The predictions available are based on various classification rules, including the following (all rules are described in detail after the list) :
- Class Pred Strict - Numerical class assignment based on strict assignment rules.
- Class Pred Most Probable - Numerical class assignment based on most probable class rules.
- Class Pred Probability <ClassID> - Probability that the sample belongs to a specific class <ClassID>.
- Class Pred Member <ClassID> - Logical (true/false) class assignment to a specific class <ClassID> based on strict multiple-class assignment rules.
- Class Pred Member - Unassigned - Logical (true/false) class assignment indicating when no class could be assigned to a sample.
- Misclassified - Logical (true/false) indicating when the strict classification does not match the known "measured" class assignment.
While viewing a plot, the Plot Controls window allows selection and viewing of the different rule predictions. For example, setting the Plot Controls X selection to "Sample Number" and the Y selection to "Class Pred Most Probable" will show the most probable class for each sample in the Scores Plot. This is displayed as the numerical class number (for reference, this is the same number viewable in the class lookup table, if the model was built from a DataSet with classes.) When selected, the Y axis ranges over all possible class numbers and a sample determined to belong to class = 2 would be shown at (x,y) = (sample number, 2).
If viewing the table of results, the columns of the table will be the different classification results and the rows the different samples. Note that this information is also available in the model or prediction structure itself in the field "classifications", as described in the Standard Model Structure page.
Class Pred Strict
Strict class predictions are based on the rule that each sample belongs to a class if the probability is > 0.50 for one and only one class. If no class has a probability > 0.50 or if more than one class has a probability > 0.50, then the sample is assigned to class zero (0) indicating no class could be assigned. These predictions provide the most safety in class assignment. If there is too large an uncertainty of a sample being a member of a class, or if the sample appears to be in more than one class, these predictions will indicate that. If samples are expected to belong to more than one class, use the Class Pred Member predictions (described below.)
Use strict class predictions if you need to see a class assignment for each sample where the model is confident the sample belongs to this class and to this class only.
Class Pred Most Probable
Most probable predictions are based on choosing the class that has the highest probability regardless of the magnitude of that probability. Note this differs from Strict class predictions because if more than one class has > 0.50 probability, the highest probability will "win" the sample. Likewise, if all probabilities are below 0.50, the largest probability still "wins".
Use these predictions if you need to see a single class assignment for each sample and are not concerned with the absolute probability of the classes. This might be the case when a model has been built on only a few example samples for each class, when samples have been pre-screened as being in one of the classes modeled, or when "no class" has no meaning.
There is always a most likely class for a sample to belong to but it is possible that the sample is not well modeled and has low probabilities for all classes. Or it is possible that two classes are similar and a sample belonging to one of them will also have a high predicted probability of belonging to the second class. In these situations it may be more useful to use the Strict class predictions.
Class Pred Probability <ClassID>
The predicted probability that a sample belongs to a particular class is a method-dependent calculation as described in Sample_Classification_Predictions#Class_Probability_Calculation, but in general is calculated such that a sample belonging to this class will have value closer to 1. Otherwise, it will be closer to 0. There will be a separate probability calculated for each class, and the class will be named in the description. For example the class named <ClassID>, is available under the label "Class Pred Probability <ClassID>".
These predictions are useful when you need to report a confidence of assignment or need to derive special rules for class assignment.
Class Pred Member <ClassID>
Class member predictions are reported as true/false for each class (<ClassID>) and are similar to the strict class predictions described earlier. A sample will be indicated as a member of a class if and only if the predicted probability for the given class is > 0.50. However, there is no restriction that a sample be assigned to one and only one class. As a result, a sample may be a member of more than one class if each class's probability is > 0.50.
These predictions should be used when an analysis permits a sample to belong to more than one class, or to no classes. That is, when the classes being predicted are not exclusionary for each other. For example, a model that reports both the water solubility of a compound (is or is not water soluble), and whether or not that compound is organic (organic vs. inorganic) should allow all combinations of both organic/inorganic and soluble/insoluble without exclusion.
The predictions for "Class Pred Member - unassigned" identify samples which were not assigned to any class because no predicted probability was greater than 0.5.
Misclassified
Misclassified predictions identify samples where the predicted "Class Pred Strict" does not agree with the sample's actual class. For SIMCA and PLSDA the actual class could include more than one class and the sample is misclassified if its "Class Pred Member <ClassID>" do not correctly predict the actual class(es). If the sample's actual class is unknown then the sample will not be identified as as misclassified.
Example of Classification Predictions
Shown below is an example Scores Plot from PLSDA run on the arch dataset. In the Plot Controls window (on left) are shown some of the classification predictions which may be plotted. The X menu is set to "Sample" and the Y menu is set to "Misclassified". The Scores Plot shows that all X samples have value 0 (NOT misclassified) except for one sample, the 16th, which has value 1, indicating it is misclassified. Looking at the "Class Pred Most Probable" predictions shows this sample is correctly predicted as belonging to class 2 ("BL"). Looking at "Class Member Pred K" and "Class Member Pred BL" both show sample 16 belonging, meaning that sample 16 belongs to each of these classes with probability > 0.5. Sample 16 actually only belongs to class "BL", however, as shown by Y="Class Measured 2 (BL)", and therefore it is considered to be misclassified. Note that none of the unknown class samples (samples 64-75) are marked as misclassified.
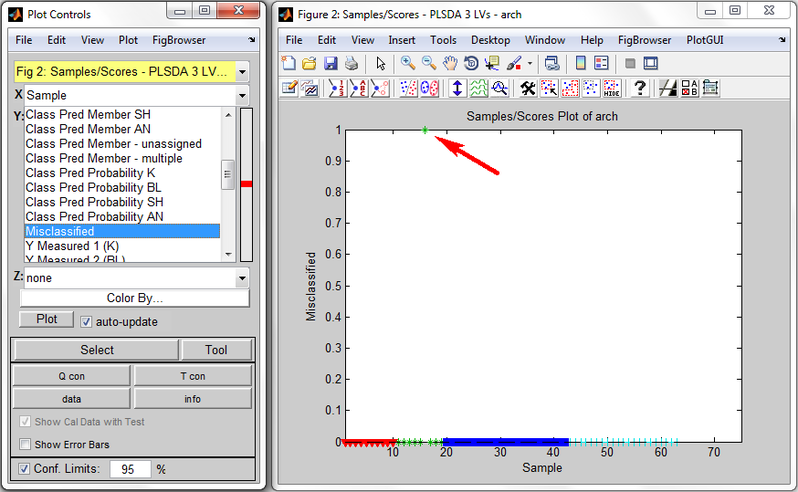
Scores Plot (right) and its Plot Controls (left) for PLSDA on arch dataset.

Class Probability Calculation
Calculating the probability that a sample belongs to each possible class is done differently for each of the classifier methods, PLSDA, SVMDA, KNN, and SIMCA. These methods are described here.
PLSDA
PLSDA calculates the probability of each sample belonging to each possible class. The calculation of probabilities for a particular class ‘A’ involves examining the predicted y values from the PLSDA model for all samples, then fitting a Gaussian distribution to the predictions for class ‘A’ samples and another Gaussian distribution to all samples which are not class ‘A’. The class ‘A’ probability distribution function then gives the probability of any sample belonging to class ‘A’ from its predicted y value. This method is described in more detail at : http://www.eigenvector.com/faq/index.php?id=38
This is done for each possible class in turn and the results are saved in PLSDA models as model.detail.predprobability.
SVMDA
The LIBSVM library calculates the probabilities of each sample belonging to each possible class if the "Probability Estimates" option is enabled in the SVMDA analysis window (or if the probabilityestimates option is set equal to 1 in command line usage). The method is explained in [3], section 8, "Probability Estimates". PLS_Toolbox provides these probability estimates in model.detail.predprobability or predict.detail.predprobability, which are nsample x nclasses arrays. The columns are the classes, in the order given by model.detail.svm.model.label (or prediction.detail.svm.model.label), where the class values are what was in the input X-block.class{1} or Y-block. These probabilities are used to find the most likely class for each sample and this is saved in pred.pred{2} and model.detail.predictedclass. This is a vector of length equal to the number of samples with values equal to class values (model.detail.class{1}).
KNN
KNN models include the probabilities of each sample belonging to each possible class in the model.classification.probability field. This is an nsample x nclasses array, where the columns are the classes, in the order given by model.classification.classids and model.classification.class. The probability that a sample belongs to class ‘A’ is calculated as the the fraction of nearest-neighbors which have that particular class.
SIMCA
SIMCA calculates the probability of each sample belonging to each possible submodel class or class group. The calculation of a sample’s probability of belonging to a particular submodel class, say class ‘A’, involves examining the Q and T2 statistics for the sample in that sub-model.
This is done for each possible class in turn and the results are saved in PLSDA models as model.classification.probability.
The calculation of class probability for a sample from Q and T2 are based on the model’s estimation of the residuals’ distribution and the specification of a ‘simcathreshold’. A default simcathreshold = 0.95 specifies a confidence level for Q and T2 which should correspond to a probability of 50%. The calculation of probability for SIMCA models is calculated by taking the confidence level of the larger statistic (C) and setting prob = (1-C)/(1-simcathreshold)*0.50.
For example, with simcathreshold at 0.95 (giving 50% probability), a confidence level of 0.98 corresponds to a probabilty of 20% and a confidence level of 0.92 corresponds to 70% probabilty. A value of 0.50 uses "raw" confidence level as probability.