Revision as of 11:51, 29 July 2010 by imported>Jeremy
Table of Contents | Previous | Next
Analysis window main menu
The Analysis window main menu is set up in a standard Windows menu format with commands grouped into menus (File, Edit, View, Analyze, Help and FigBrowser) across the menu bar. Some of these commands are available in other areas of the application.
- Analysis window main menu

The Edit > Options menu contains the following options:
- Method Options - Opens the Options dialog box which lists options for controlling the settings that are specific to the currently selected analysis method such as confidence limits settings, algorithm selections, and constraints. Some analysis methods have more setting options than others. See Options dialog box.
|
- Analysis GUI Options - Opens the Options dialog box which lists options for the currently opened Analysis window, including the maximum number of factors displayed, the font size for the Control pane, and the display in the Analysis Flow Chart pane. See Options dialog box.
|
- Default Plots - Opens the Default Plots dialog box in which you can adjusting default Scores plots for given methods.
|
- Preferences (Expert) - Opens a Preferences (Expert) window which you use to override all values for all Solo options. Because there is no checking for validity of settings when you use this tool, you must be very cautious using it. If problems occur, try resetting the default values using "Factory Default."
|
To specify the Window docking settings
By default, when you first open Solo, every data figure and interface in Solo is a floating window, which is a window that you can drag to any position on your desktop. You can also resize a floating window. You can select different Window docking settings to change the floating behavior of data figures, interfaces, or both.
| 1.
|
On an Analysis window main menu, click Edit > Options > Window Docking Settings.
|
- The Docking Settings dialog box opens. The first docking setting (All data figures and interfaces open as separate windows) is selected by default.
- Docking Settings dialog box

| 2.
|
To select a different Window docking setting, click the setting.
|
- The Docking Settings dialog box closes and you return to the Analysis window. The new docking setting is effective after you close and re-open a window.
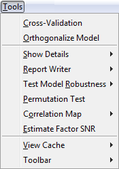
The Tools menu contains a number of tools which you can use to investigate and gather information about the currently loaded data and to assess a model's performance.
- Tools menu
See:

