Cross tool
Jump to navigation
Jump to search
Cross-section Tool
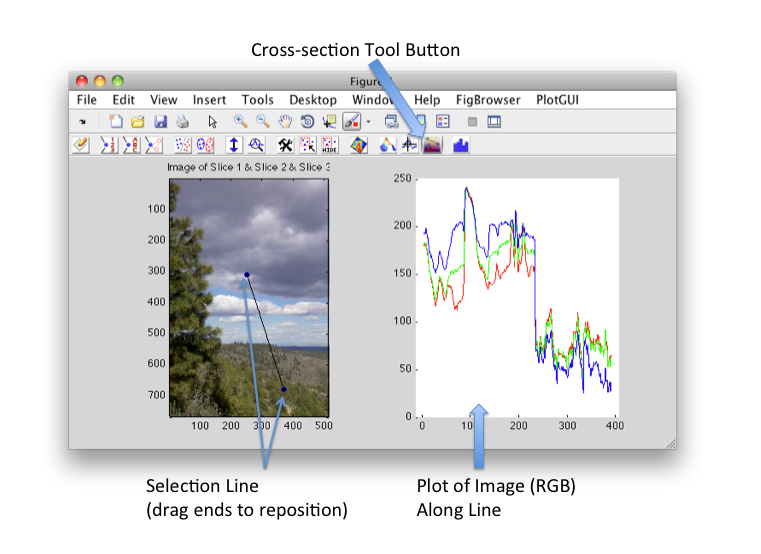
The Cross-section Tool plots underlying image intensity data along a line. To open the Cross-section Tool, make sure only a single image in PlotGUI is displayed then click on the Cross-section button and use the mouse (click and drag) to inicate the line position. A plot will immediately appear to the right of the image. The ends of the line can be dragged to reposition. Up to 3 lines (RBG layers) will be displayed.
