Analysis Window: Main Menu
Table of Contents | Previous | Next
The Analysis window main menu is set up in a standard Windows menu format with commands grouped into menus (File, Edit, Preprocess, Analysis, Tools, Help and FigBrowser) across the menu bar. Some of these commands are available in other areas of the application.
- Analysis window main menu
The File menu provides access to loading, importing, saving, and exporting data and models. More information on these topics can be found in the topics: Loading and Importing Data and Exporting_Models.
The Edit menu provides access to the DataSet Editor for editing and Plot Controls for plotting of the calibration and validation data.
The Edit menu also provides control over various interface and analysis options through the Edit > Options menu:
|
|
|
|
|
|
To specify the Window docking settings
By default, when you first open Solo, every data figure and interface in Solo is a floating window, which is a window that you can drag to any position on your desktop. You can also resize a floating window. You can select different Window docking settings to change the floating behavior of data figures, interfaces, or both.
| 1. | On an Analysis window main menu, click Edit > Options > Window Docking Settings. |
- The Docking Settings dialog box opens. The first docking setting (All data figures and interfaces open as separate windows) is selected by default.
- Docking Settings dialog box
| 2. | To select a different Window docking setting, click the setting. |
- The Docking Settings dialog box closes and you return to the Analysis window. The new docking setting is effective after you close and re-open a window.
The Preprocess menu provides access to the preprocessing window from which you can modify the data pre-treatment being performed on the data. Once preprocessing has been selected, you can make the current preprocessing the default for the x-block or y-block by selecting the "Use as default" menu item from the x-block or y-block menus, respectively.
The Analysis Menu provides access to various analysis methods within the GUI. More details on these methods can be found here
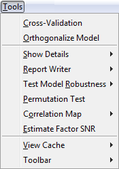
The Tools menu contains a number of tools which you can use to investigate and gather information about the currently loaded data and to assess a model's performance.
- Tools menu
- Cross-Validation - Sets or modifies the settings related to cross-validation of models. See Cross-Validation.
- Orthogonalize Model - Provides orthogonalized PLS and PLSDA models (also known as OPLS models) in which all y-correlated information compressed in the first component. See Orthogonalizepls.
- Test Model Robustness - Assess model sensitivity to typical interferences. See Test Model Robustness.
- Permutation Test - Reorders the y-block and recalculates model to allow an estimation of the error levels expected for random correlation.
- Correlation Map - Shows the degree of correlation among the variables. See Correlation Map.
- Estimate Factor SNR - Provides an estimate of the number of significant PCA factors for the current data using the Estimatefactors algorithm.
- View Cache - Changes the model cache viewing options. See Model Cache
- Toolbar - Provides access to all toolbar items via menu controls

